
https://siderite.dev/blog/lichess-tools---user-manual#showKmaps
How to visualize K-MAPS analysis
... a LiChess Tools use case miniature
Recently I've implemented something I've heard about in an Anna Cramling video: K-MAPS analysis. The idea is that you want to understand the position from five principles of chess:
- King safety (K)
- Material (M)
- piece Activity (A)
- Pawn structure (P)
- Space advantage (S)
In LiChess Tools all you have to do is enable the feature: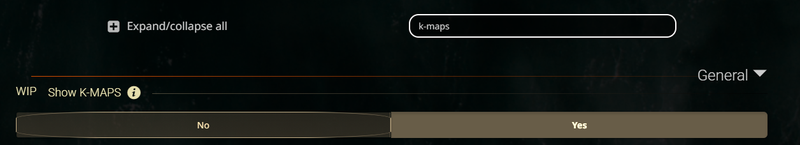
and then, in analysis scenarios, like Analysis Board, Studies, game analysis or even watching TV or broadcasts, you get a "K-MAPS" text where each letter changes color and shade from green (good) to neutral (white) to red (bad).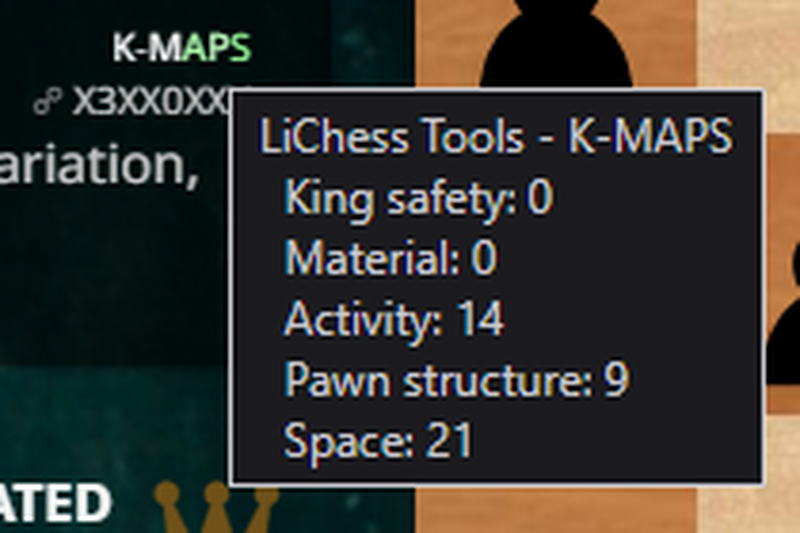
All values are relative (so a red King safety can be because the opponent has a much better one) and normalized in an interval of -100 to 100.
Technically, each value is calculated as follows:
K - pawnshield * 2 - openFilesNextToKing * 1.5 - enemyThreatsNextToKing - holesNextToKing
M - sum of pawn and piece values
A - mobility * 0.1 + openFilesWithRookOrQueen * 0.3 + centralControl * 0.5
P - - doubledPawns * 0.5 - isolatedPawns * 0.5 + (passedPawnsBasedOnRank) * 0.2 - (islands-1) * 0.5 - backwardPawns * 0.3
S - controlledSquaresInEnemySide * 0.1 + bonusForCentralSquares
The idea here is that you can see immediately where you can improve or what to take advantage of. The formulas are still under refinement, but the feature works right now.
Hope it helps!
You may also like
 TotalNoob69
Did you know Lichess can do this?! Commands
... yes, Lichess has a command line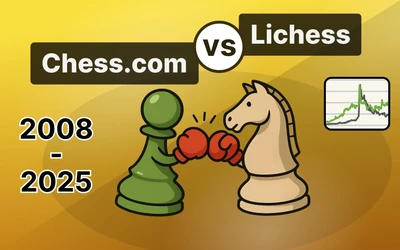 ChessMonitor_Stats
Where do Grandmasters play Chess? - Lichess vs. Chess.com
This is the first large-scale analysis of Grandmaster activity across Chess.com and Lichess from 200… CM HGabor
How titled players lie to you
This post is a word of warning for the average club player. As the chess world is becoming increasin… GM Avetik_ChessMood
10 Things to Give Up to Enjoy Chess Fully
Discover how embracing a lighter mindset can help you enjoy chess again and achieve better results. TotalNoob69
Did you know Lichess can do this?! Puzzles' secret level
... not only what you see in the main menu TotalNoob69